Queued Up: Characteristics of Power Plants Seeking Transmission Interconnection
Queued Up: Characteristics of Power Plants Seeking Transmission Interconnection
Electric transmission system operators (ISOs, RTOs, or utilities) require proposed power plants seeking to connect to the transmission grid to undergo a series of impact studies before they can be built. This process establishes what new transmission equipment or upgrades may be needed before a project can connect to the system and assigns the costs of that equipment. The lists of projects in this process are known as “interconnection queues”.
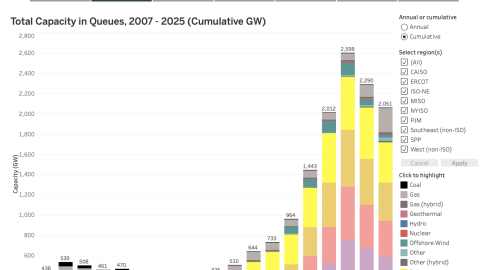
As of the end of 2025, over 2,060 gigawatts (GW) of total generation and storage capacity were actively seeking connection to the grid. However, most projects that apply for interconnection are ultimately withdrawn, and those that are built are taking longer on average to complete the required studies and become operational. Data from these queues nonetheless provide a general indicator for future electric capacity additions.
The attachments below include an Excel data file and a PDF data visualization slide-deck. The Excel data file was last updated in May, 2026, and features interconnection data through the end of 2025. The PDF report was published in June 2026, and analyzes interconnection data and metrics through the end of 2025.
Interconnection queue data were compiled, cleaned, and aggregated in partnership with https://www.interconnection.fyi. The Excel data file includes interconnection data from all seven ISOs/RTOs alongside 50 non-ISO utilities, which collectively represent ~98% of the currently installed U.S. electric generating capacity.
Key highlights from the Queued Up: 2026 Edition (featuring data through 2025) include:
- As of the end of 2025, there were ~8,200 projects actively seeking grid interconnection in the U.S., representing 1,312 GW of generation and approximately 749 GW of storage.
- High withdrawal rates alongside relatively fewer new requests resulted in a 10% decrease in total active queue volume compared to the prior year.
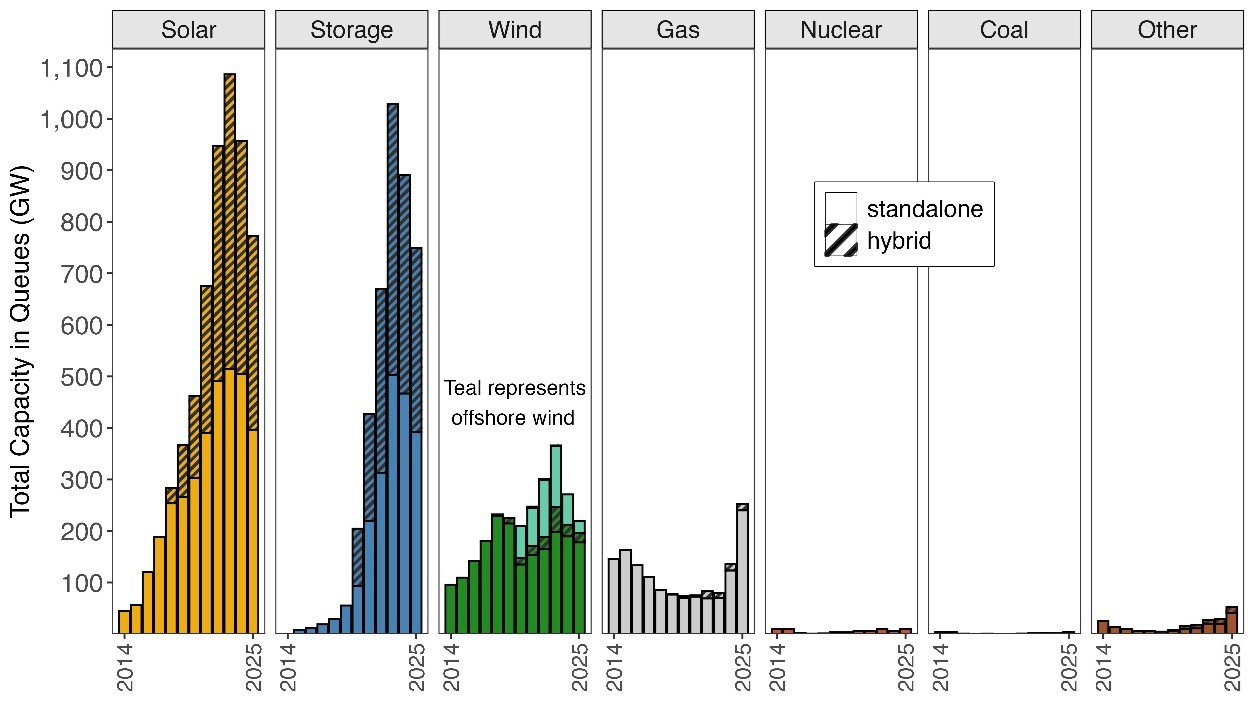
- Active natural gas capacity (253 GW, +86%) increased in 2025, while solar (773 GW, -19%), storage (749 GW, -16%) and wind (220 GW, -19%) capacity decreased.
- 549 GW of capacity already has a draft or executed interconnection agreement (IA) but has not yet reached commercial operations, including 256 GW of solar, 161 GW of storage, 76 GW of wind, and 45 GW of gas.
- The time projects spend in queues before reaching COD is increasing. For the regions with available data, the median duration from IR to COD was over 5 years for projects built in 2025.
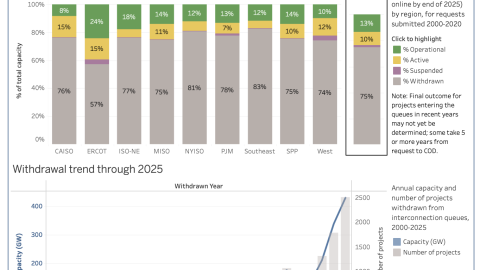
- Ultimately, most of this proposed capacity will not be built. Only 13% of capacity that submitted interconnection requests from 2000-2020 had reached commercial operations by the end of 2025; 75% of that capacity had been withdrawn and 10% was still active.
- FERC Order 2023 and various other reforms are being implemented. These are important measures to reduce interconnection bottlenecks and enhance grid system reliability, but it is too early to measure and assess their full impact.
For further details on these and other findings, please refer to the PDF slide-deck and Excel data file, which can be downloaded at the links below under “Attachment”, or via the related webpage here. The briefing is also accompanied by an interactive data visualization here and interactive maps here.
A webinar highlighting the findings from the latest edition of Queued Up will be held on Thursday July 16 at 1pm Eastern / 10am Pacific. Register for the webinar here.