2021 was a big year for hybrid power plants—especially PV+storage

Newly released data compilation from Berkeley Lab tracks operational and proposed plants
Falling battery prices and the growth of variable renewable generation are driving a surge of interest in “hybrid” power plants that combine, for example, utility-scale wind and/or solar generating capacity with co-located batteries. While most of the current interest involves pairing photovoltaic (PV) plants with batteries, other types of hybrid or co-located plants with wide-ranging configurations have been part of the U.S. electricity mix for decades.
A newly released briefing from Lawrence Berkeley National Laboratory tracks and maps both operational and proposed hybrid/co-located plants across the United States while also synthesizing data mined from power purchase agreements (PPAs). The scope of this data summary includes co-located hybrid plants that pair two or more generators and/or that pair generation with storage at a single point of interconnection, and full hybrids that feature both co-location and co-control. ‘Virtual’ hybrids that are not co-located are excluded, as are smaller (often behind-the-meter) plants with less than 1 MW of generating capacity (i.e., our focus is on utility-scale plants). This briefing is accompanied by two data visualizations, one focused on online plants and the other on those in interconnection queues, and an Excel data file with detail on individual plants.
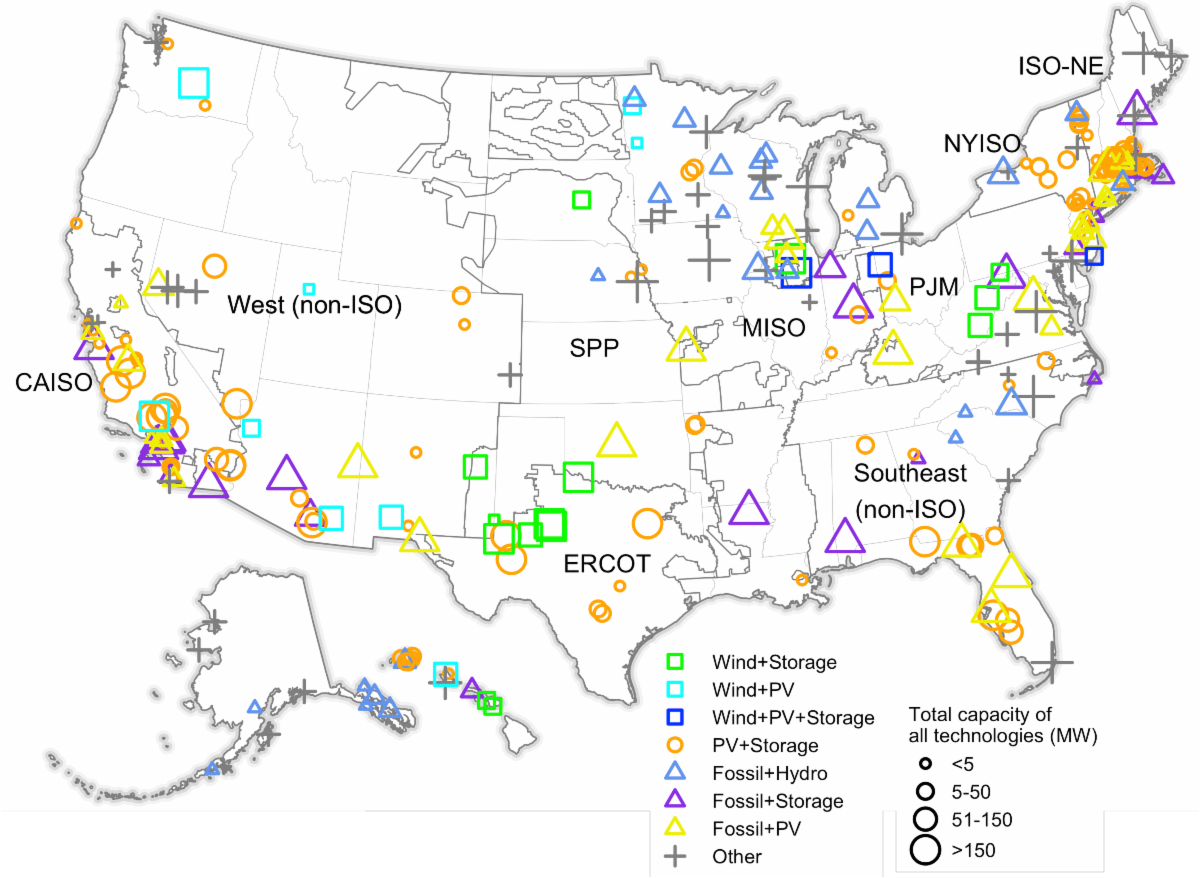
At the end of 2021, there were nearly 300 hybrid plants (>1 MW) operating across the United States, totaling nearly 36 GW of generating capacity and 3.2 GW/8.1 GWh of energy storage. PV+storage plants are by far the most common, and can be found throughout much of the country (see map), though the largest such plants are in California and the West, as well as Texas and Florida. But there are nearly twenty other hybrid plant configurations as well, including several different fossil hybrid categories (each dominated by the fossil component) as well as wind+storage, wind+PV, wind+PV+storage, geothermal+PV, and others.
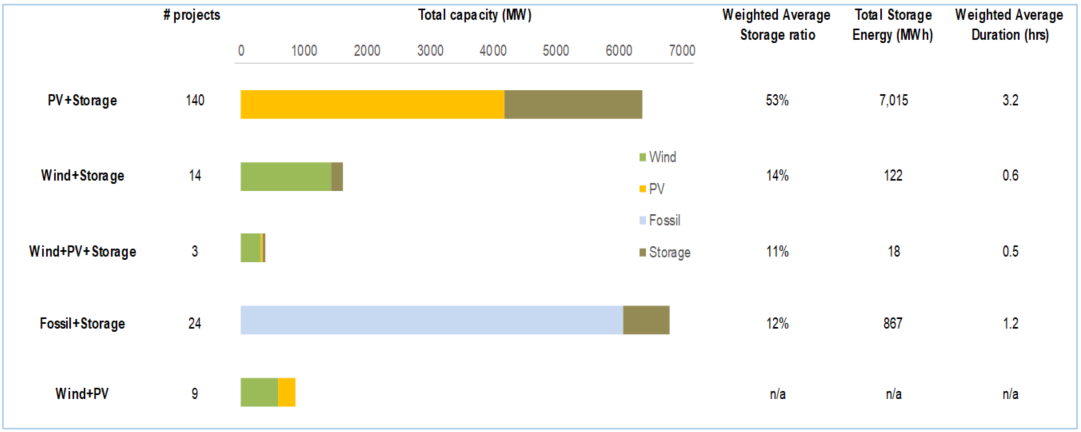
Among the operational generator+storage hybrids, PV+storage dominates in terms of plant number (140), storage capacity (2.2 GW/7.0 GWh), storage:generator capacity ratio (53%), and storage duration (3.2 hours). This relatively high storage ratio and duration in particular suggest that storage is providing resource adequacy (i.e., capacity firming) and energy arbitrage (i.e., shifting power sales from lower- to higher-priced periods) capabilities to PV+storage plants. In contrast, the relatively low storage ratio and short duration of wind+storage plants suggests that they are primarily targeting the ancillary services markets (e.g., providing regulation and/or reserves).
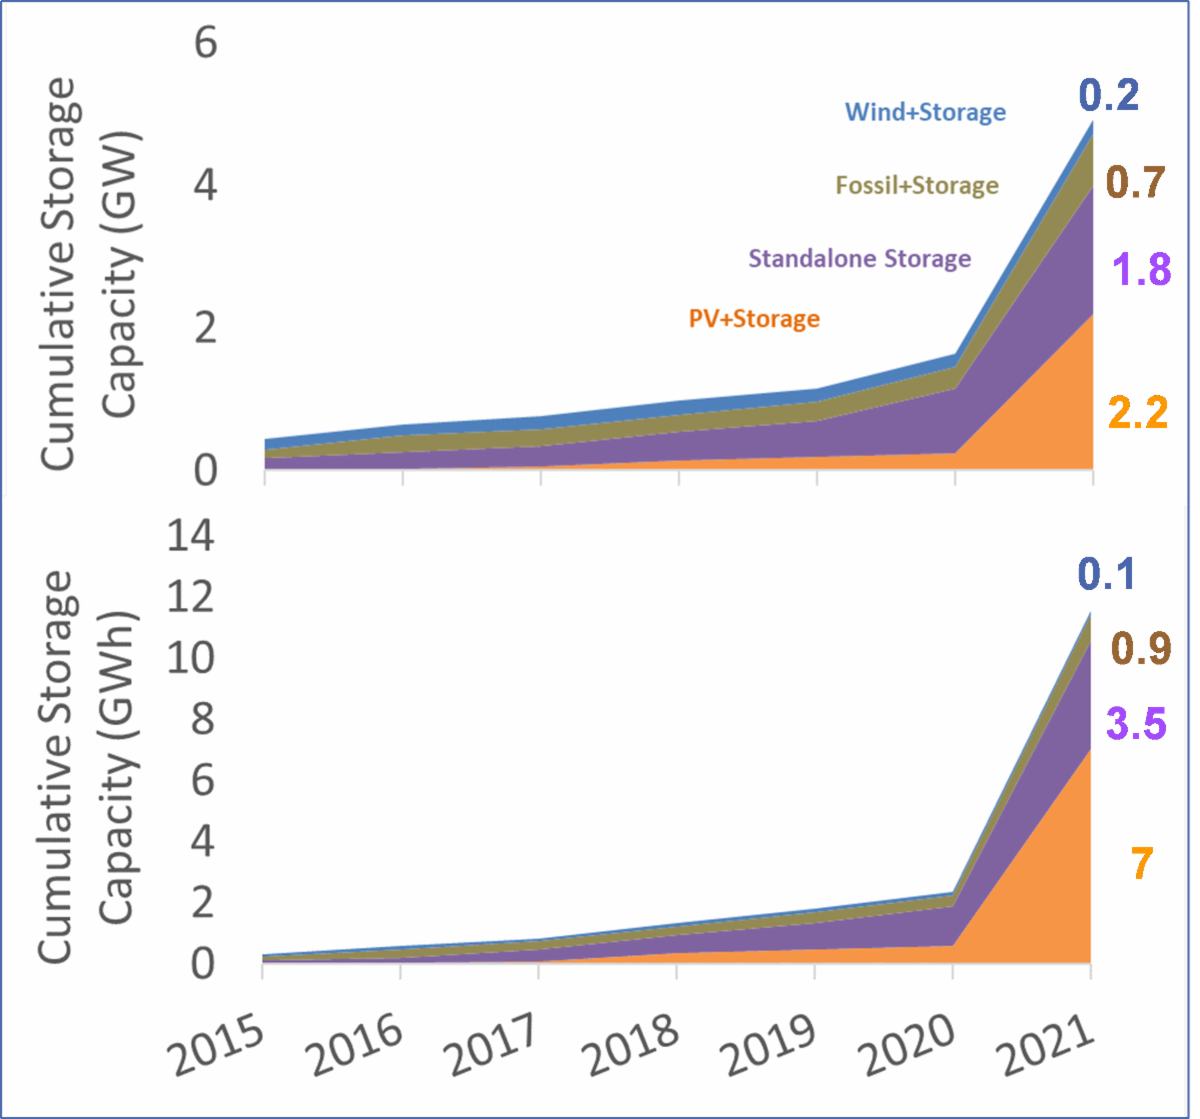 Last year was a breakout year for PV+storage hybrids in particular: 67 of the 74 hybrids added in 2021 were PV+storage. By the end of 2021, there were more GW of battery capacity operating in PV+storage hybrids (2.2 GW) than as standalone storage plants (1.8 GW). The difference is even starker in energy terms, with PV+storage plants hosting twice as much battery capacity as standalone storage plants (7 GWh vs. 3.5 GWh, respectively). Much of the battery capacity added in hybrid form in 2021 was a battery retrofit to a pre-existing PV plant.
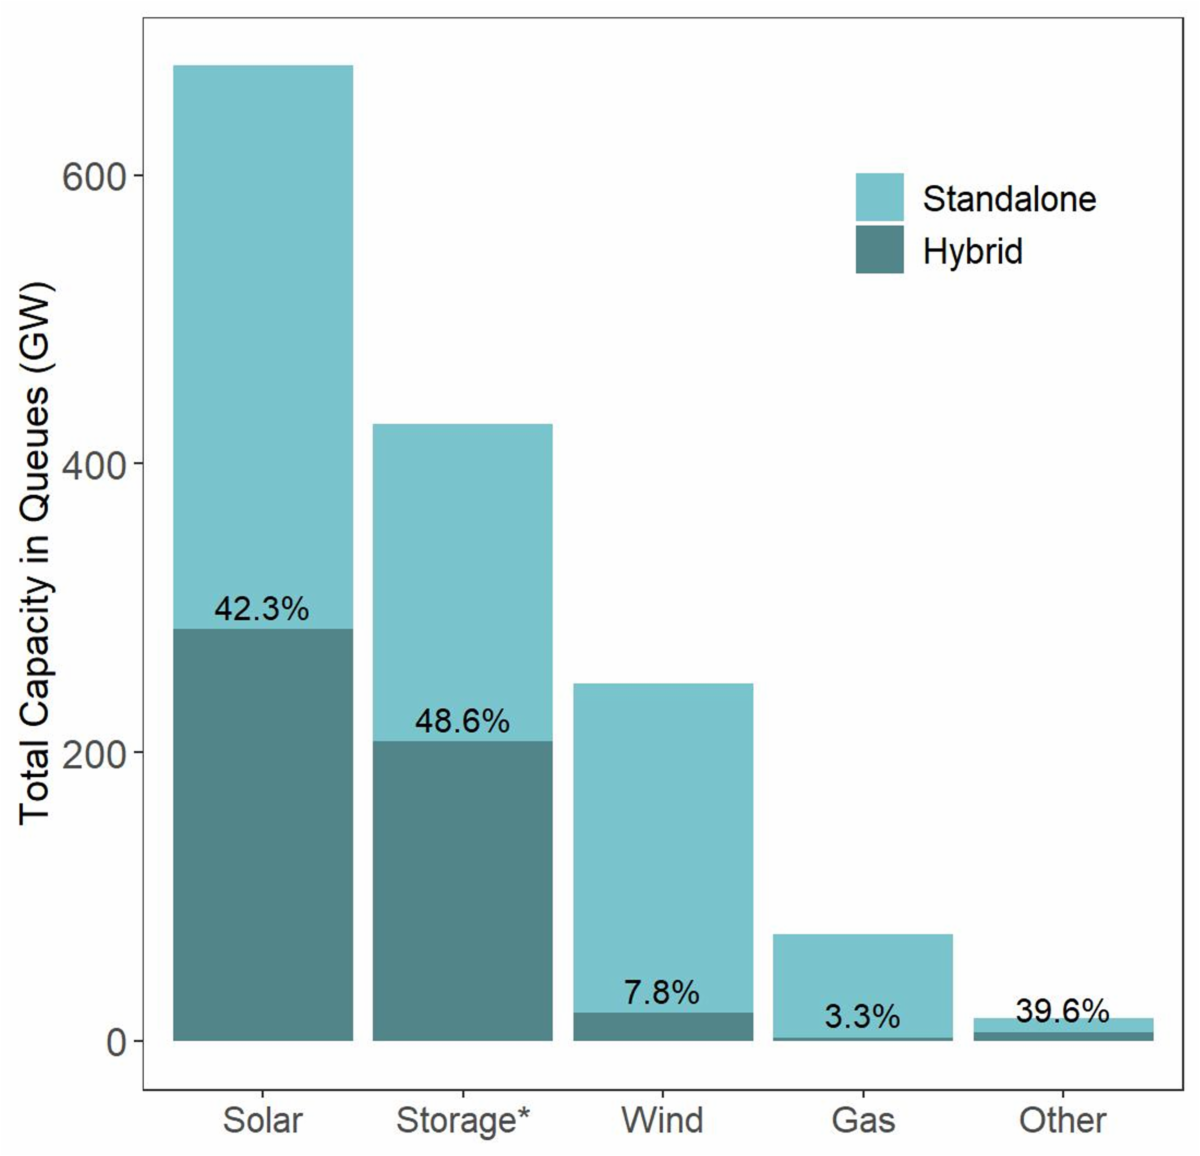 Data on plants under development from the interconnection queues of all seven ISOs/RTOs plus 35 individual utilities suggest that these hybridization trends are likely to continue. At the close of 2021, there were more than 670 GW of solar plants in the nation’s queues; 285 GW (~42%) of this capacity was proposed as a hybrid, most typically pairing PV with battery storage (PV+storage represented nearly 90% of all hybrid capacity in the queues). For wind, 247 GW of capacity sat in the queues, with 19 GW (~8%) proposed as a hybrid, again most-often pairing wind with storage (wind+storage represented ~4% of all hybrid capacity in the queues). Meanwhile, nearly half of all storage in the queues is estimated to be part of a hybrid plant.
While many of these proposed plants will not ultimately reach commercial operations, the depth of interest in hybrid plants—especially PV+storage—is notable, particularly in certain regions. For example, in CAISO, 95% of all solar capacity and 42% of all wind capacity in the queues is proposed as a hybrid. Commercial interest in California no doubt derives from the state’s energy policies, but is also driven by the pronounced daily wholesale pricing patterns induced by high solar penetrations that create arbitrage opportunities for storage that do not yet exist in the same magnitude in most other wholesale markets.
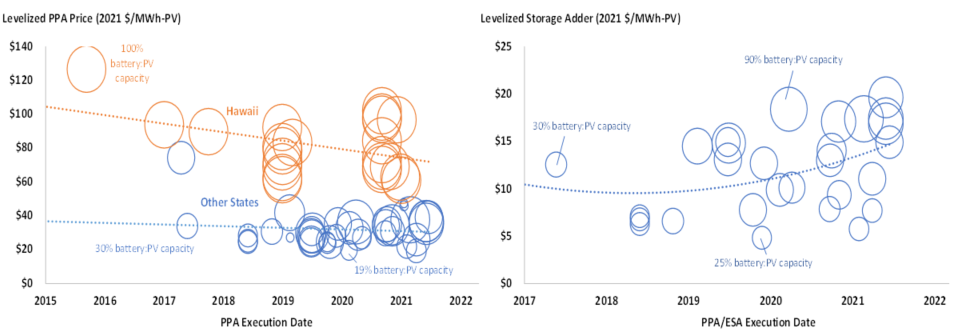
Finally, the report also surveys pricing data from 67 PV+storage PPAs in 10 states totaling 8.0 GW of PV and 4.5 GW/18 GWh of batteries. Twenty-three of these 68 PPAs are from operating PV+storage plants, while the other 44 plants are still under construction or in development. Though PV+storage PPA prices have fallen over time (left graph, below), “levelized storage adders” have recently increased somewhat to ~$5500/MW-month, ~$45/MWh-stored (assuming one full cycle per day), or ~$15/MWh-PV (as shown in the right graph, below). Some of the recent price increase could simply reflect a trend towards higher battery:PV capacity ratios on the mainland over time (whereas this ratio is typically pegged at 100% in Hawaii), which will increase costs, all else being equal. The well-publicized impact of inflationary and supply chain pressures on battery prices is no doubt a contributor as well.
For further details on these and other findings, along with high-level case studies of a few operating hybrid plants, please refer to the short PowerPoint-style data compilation, which can be downloaded here. The briefing is also accompanied by two data visualizations, one focused on online plants and the other on those in interconnection queues, and an Excel data file with detail on individual plants.
Finally, we will present this report during a free one-hour webinar on Thursday, August 18 at 1 PM eastern.