Berkeley Lab’s “Utility-Scale Solar” report sees continued growth and falling costs for big solar

We are pleased to release the 2019 edition of Berkeley Lab’s Utility-Scale Solar report, which presents analysis of empirical project-level data from the U.S. fleet of ground-mounted photovoltaic (PV) and concentrating solar-thermal power (CSP) projects with capacities exceeding 5 MWAC. While focused on key developments in 2018, this report explores trends in deployment and project design, installed project prices, operating costs, capacity factors, power purchase agreement (PPA) prices, and the levelized cost of energy (LCOE) among the U.S. fleet of utility-scale solar projects. This year’s edition also includes a new section focused on the wholesale market value of solar.
Key findings from this year’s report include:
- More than 4 GWAC of new utility-scale PV capacity came online in 2018, bringing cumulative installed capacity to more than 24.5 GWAC across 39 states. Florida added one quarter of all new capacity in 2018, deposing California as the largest state market for the first time ever, and leading the Southeast to its second consecutive regional title in terms of new installed capacity.
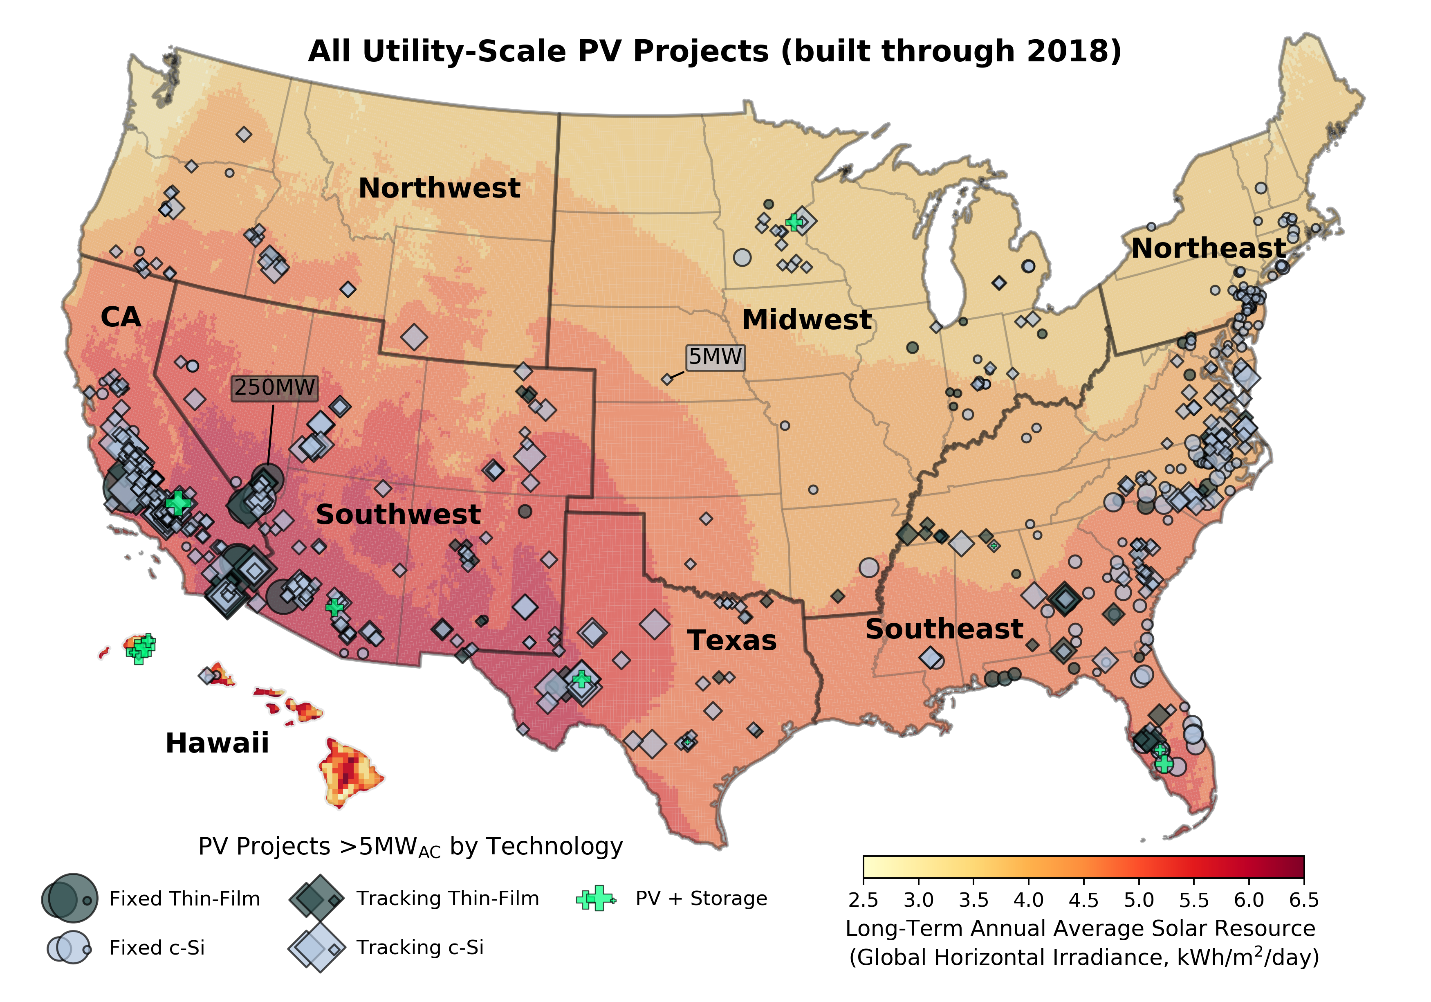
- Projects that track the sun throughout the day continue to outnumber fixed-tilt projects, with single-axis tracking employed by more than 70% of all new utility-scale PV capacity added in 2018.
- Median installed project prices from a 2.5 GWAC sample of projects completed in 2018 declined to $1.6/WAC (or $1.2/WDC), with the lowest 20th percentile priced at or below $1.3/WAC (or $0.9/WDC).
- Project-level capacity factors vary widely, from 12% to 35% (on an AC basis), with a sample median of 25%. The high degree of project-level variation is based on a number of factors, including insolation, tracking vs. fixed-tilt, inverter loading ratios, performance degradation, and curtailment—all of which are explored in detail in the report.
- PPA prices from a sample of contracts signed in 2018 or 2019 continued to decline, to below $30/MWh on average and with a few PPAs even below $20/MWh (levelized, in 2018 dollars). PPA prices have followed solar’s LCOE lower over time, suggesting a relatively efficient market.
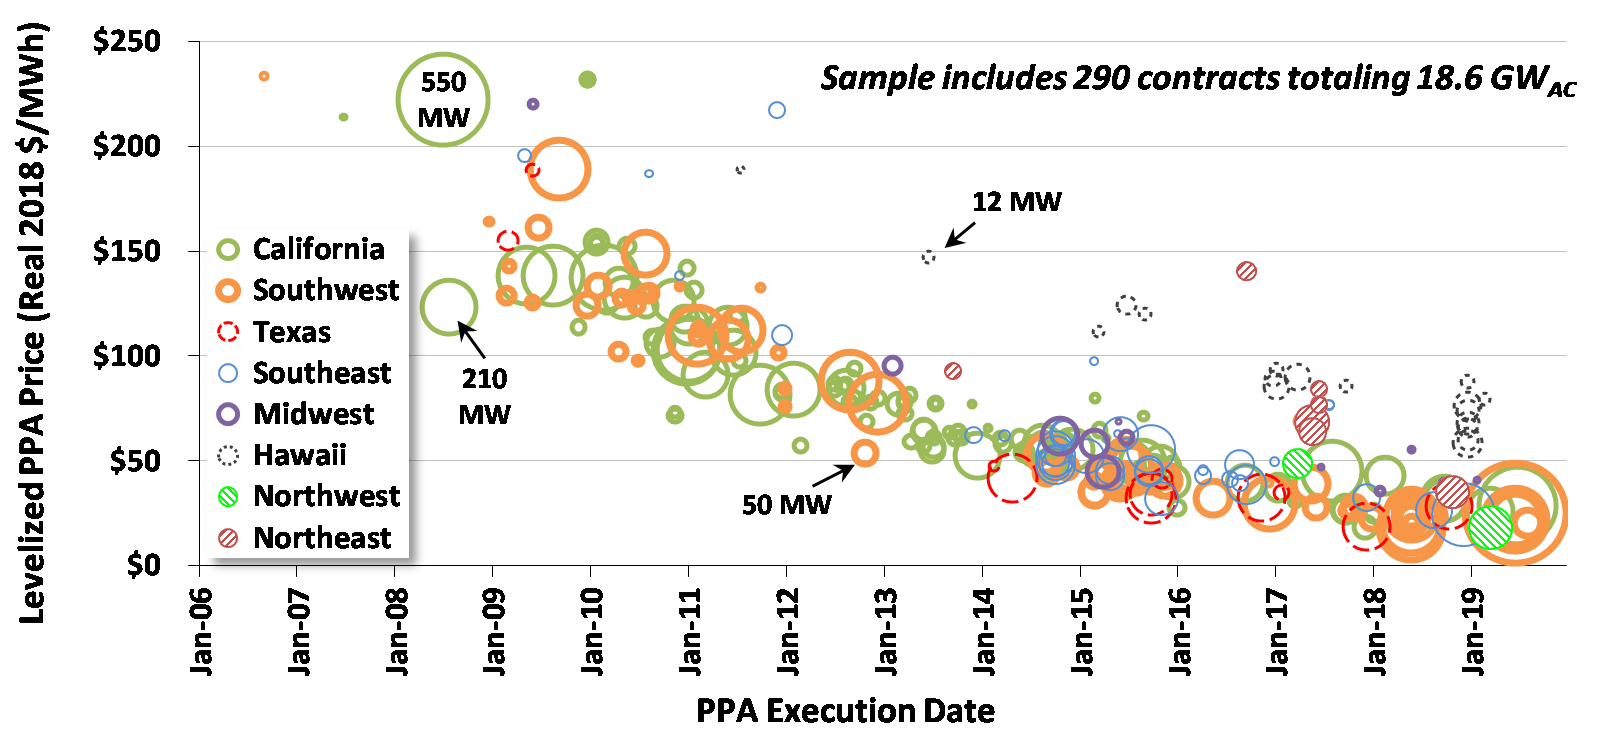
- Although solar’s “duck curve”-related decline in wholesale market value within California has been much-publicized, in most other regions of the country, solar still provides above-average value. In 2018, solar’s market value (defined here to include only energy and capacity value) exceeded average wholesale prices for all but two—California and New England—of the seven independent system operators (ISOs) across the United States. However, even in California, where solar’s market value has steadily declined over time to 79% of average wholesale prices in 2018, falling PPA prices have largely kept pace, thereby more or less maintaining solar’s competitiveness over time. Solar in other ISOs offers higher value yet, in some cases, similar or even lower PPA price levels, which may be one reason why the market has been shifting away from California and into other less-sunny regions.
- Adding battery storage to shift a portion of excess mid-day solar generation into evening hours is one way to increase the value of solar. These PV+battery hybrid projects are becoming increasingly common, particularly in high-penetration markets like Arizona, California, Nevada and Hawaii: seven such projects came online in 2018, and another 30 have been announced in some detail, often at the time of securing a PPA (we analyze these 37 projects within the report). More speculatively, but also a harbinger of things to come, at least 55 GW of PV+storage projects were in the interconnection queues across the country at the end of 2018, accounting for 20% of all solar capacity in the queues at that time.
The full Utility-Scale Solar report, along with an accompanying summary slide deck, a data file, and a number of interactive data visualizations, can be found at utilityscalesolar.lbl.gov.
The report authors will summarize key findings from the report via a free webinar on Thursday, January 9th at 10 AM Pacific/1 PM Eastern.
Register here: https://lbnl.zoom.us/webinar/
Berkeley Lab is also seeking feedback on the report through this brief questionnaire, which will help us to refine future editions.
For questions on the report, feel free to contact Mark Bolinger ([email protected]) or Joachim Seel ([email protected]) at Lawrence Berkeley National Laboratory.
We appreciate the funding support of the U.S. Department of Energy Solar Energy Technologies Office in making this work possible.