Exploring Wholesale Energy Price Trends: The Renewables and Wholesale Electricity Prices (ReWEP) tool, Version 2023.1

The Renewables and Wholesale Electricity Prices (ReWEP) visualization tool from Berkeley Lab has been updated with nodal electricity pricing and wind and solar generation data through the end of 2022. The tool allows users to explore trends in wholesale electricity prices and their relationship to wind and solar generation.
The ReWEP tool allows users to compare nodal pricing trends across locations, regions, and different timeframes. The tool consists of maps, time series, and other interactive figures that provide: (1) a general overview of how average pricing, negative price frequency, and extreme high prices vary over time, and (2) a summary of how pricing patterns are related to wind and solar generation. Interactive functionality allows investigation by grid regions (ISOs/RTOs), year, and season, and over diurnal cycles.
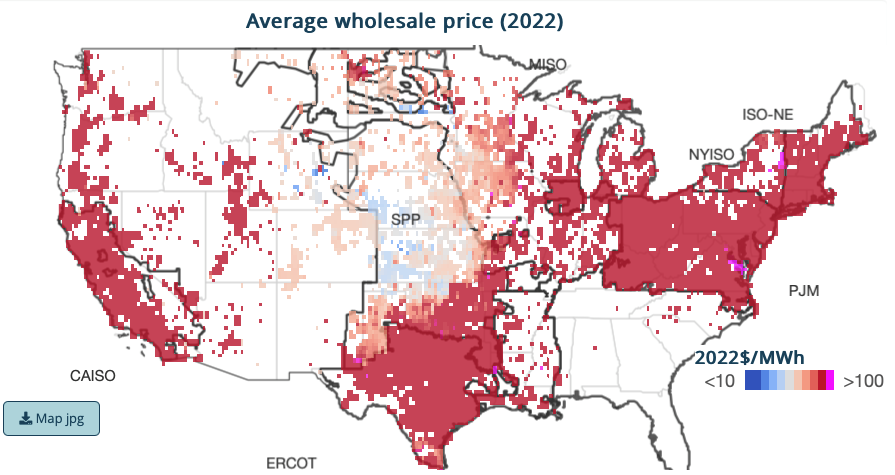
Figure 1. This screenshot from the ReWEP tool shows annual average nodal prices across the major wholesale electricity markets in the United States in 2022. Of note are the relatively high prices in most locations with the exception of more mild prices located in regions with the highest concentration of wind generation (e.g., Kansas, Nebraska, Western Iowa). The user can also choose to map the frequency of negative prices and the average price of the 100 hours in each year with highest prices.
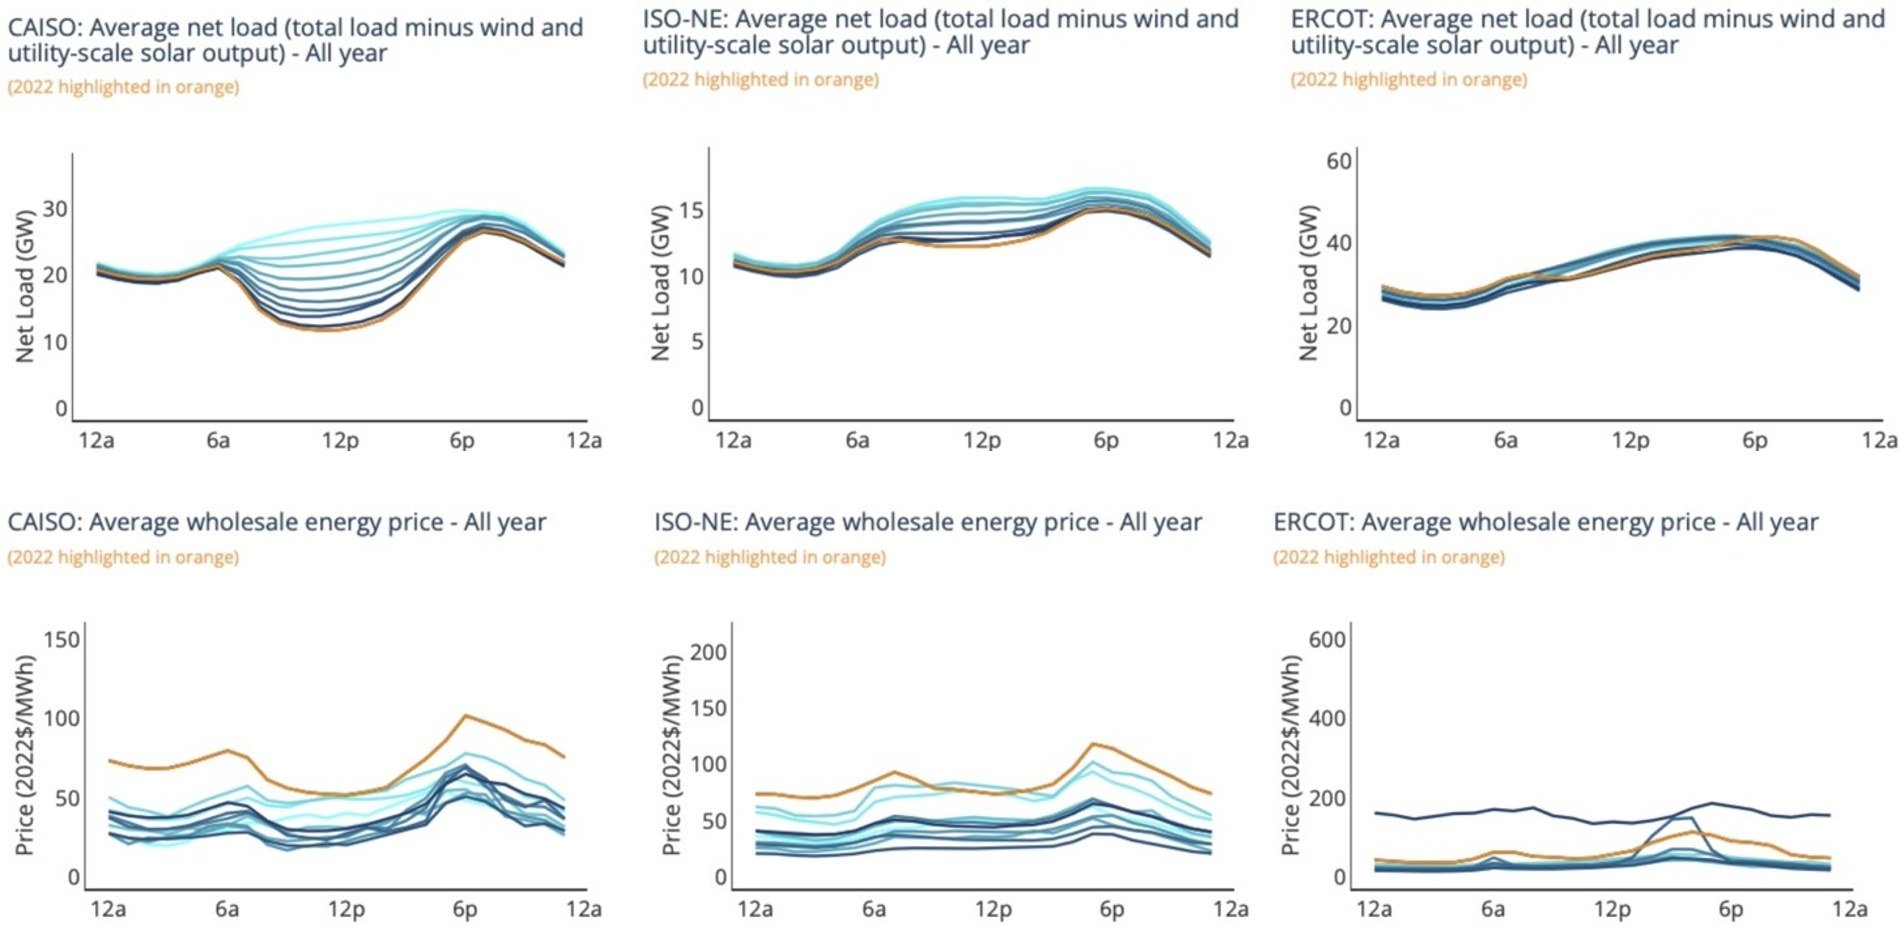
Figure 2. These screenshots from the ReWEP tool show the daily cycle of net load (top row) and the daily cycle in average prices (bottom row) across California, New England, and Texas, left to right, respectively. The proportion of total regional generation from solar is highest in California, then New England, then Texas, and the impact of solar on both net load and price follows the regional proportion of energy derived from solar. In California, electricity prices are lowest during midday hours. Lighter color lines show data from older years and year 2022 is highlighted in orange.
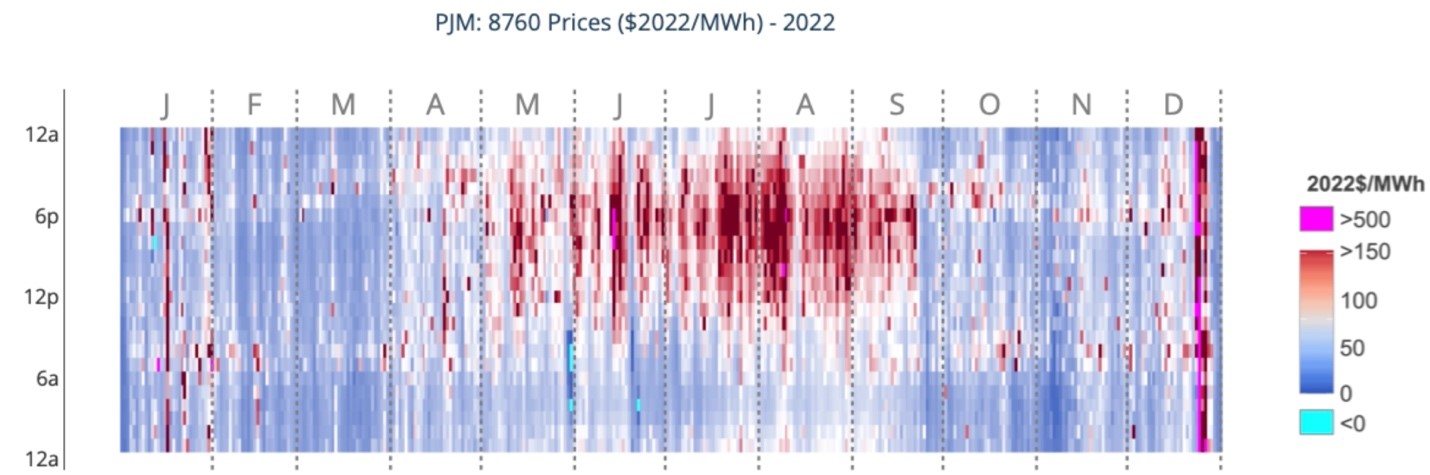
Figure 3. This screenshot from the ReWEP tool shows the regional average hourly price by day and hour (365X24) for the PJM region (a region covering states in the mid-Atlantic region to portions of the Midwest). High prices are concentrated during summer afternoons, and high prices associated with Winter Storm Elliott can be seen in late December.
Figures 1 through 3 above highlight visualizations that can be created with the tool. Some key observations for 2022 include:
- Electricity prices in 2022 were relatively high at almost all locations (Figure 1). High prices are linked to the high cost of natural gas in 2022. The lowest average electricity prices were found in regions with dense concentrations of wind power. For example, wind generation in Kansas accounted for more than 60% of in-state electricity sales.
- In 2022, solar power generation lowered mid-day net load across multiple regions, including California, New England, and Texas (Figure 2, top row). Net load refers to total electricity demand less wind and solar generation. The “duck curve” describes the hourly net load shape that occurs when solar generation accounts for a substantial portion of a region's generation. Figure 2 shows three stages of the duck curve in practice: A fully developed duck shape in CAISO, a partially developed duck shape in New England, and the beginning of a duck shape in ERCOT. In the bottom row of Figure 2, the impact on average pricing can be observed, with mid-day prices dipping in proportion to the proportion of solar relative to load.
- Electricity prices in the PJM Interconnection, which serves parts of the Mid-Atlantic and Midwest regions in the United States, peaked during late summer afternoon (Figure 3). The timing of these high prices suggests they could potentially be addressed by new solar deployment. We note that a record amount of solar projects have been proposed for PJM (along with other regions).
The ReWEP tool can be found at: https://emp.lbl.gov/renewables-and-wholesale-electricity-prices-rewep.
We appreciate the funding support of the U.S. Department of Energy Solar Energy Technologies Office and Wind Energy Technologies Office in making this work possible.