New Berkeley Lab Report Documents Trends in System Impacts, Reliability and Market Value of Solar in the United States

With continued deployment of solar across the United States, assessing the interactions of solar with the power system is increasingly important. Impacts of solar on the bulk power system are obvious in the CAISO system, including changes to the net load, wholesale prices, and the market value of solar. The same impacts are not seen in ISOs with much lower penetrations of solar.
As solar generation increases, it is expected to progressively impact the bulk power system—changing prices for energy and other grid services. Solar generation is driven by sunshine and thus often highly correlated over the course of a day within a region. Without the deployment of storage or an increase in price-responsive load, growth in solar capacity is accompanied by lower wholesale prices during sunny hours, leading to a decline in market value.
Berkeley Lab’s new Solar-to-Grid report confirms these expectations in California, where solar penetration is the highest in the country and its effects on net load, wholesale prices, and solar’s market value can readily be seen. These pricing and value impacts, meanwhile, are influencing other power-system decisions—signaling the low cost to meeting new load during the middle of the day, and increasing the attractiveness of storage and other flexible resources to meet early-evening net-load peaks and ancillary service requirements. In contrast, the effects are small in most other organized markets where solar penetration is below 5%.
The decline in solar’s wholesale market value in California has been matched by reductions in the cost of solar, thus maintaining solar’s overall net-value proposition even in the absence of hybridization with storage. In markets outside California, costs have so far declined faster than market value, often making solar more competitive than ever before.
Berkeley Lab’s new report focuses on the historical contribution to reliability, trends in market value, and impacts on the bulk power system of solar deployed in the U.S. through the end of 2019. The scope of the analysis includes the seven organized wholesale power markets, as well as ten utilities outside of those markets. The analysis is based on high-resolution data, including historical hourly generation profiles for each individual solar plant in the U.S. larger than 1 MW, county-level aggregate profiles for smaller-scale solar installations, and nodal energy prices.
Highlights include:
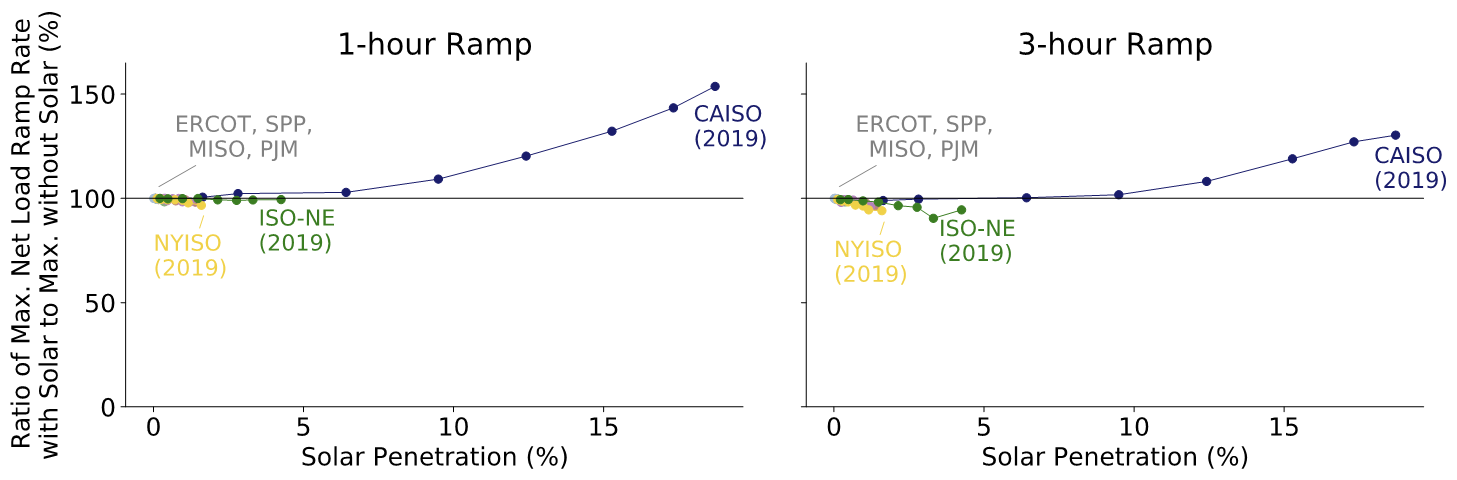
Solar Generation: Solar deployment in the California Independent System Operator (CAISO), where solar generation was equivalent to 18.7% of annual load in 2019, far exceeds the level in other ISOs. The New England Independent System Operator (ISO-NE) has the second-highest penetration, with solar generation equivalent to 4.3% of annual load in 2019. All other ISOs have annual solar generation shares at or below 2%.
Reliability Contribution: Solar’s contribution to the overall resource adequacy of the power system is measured by its “capacity credit”. While calculation methods vary across ISO/RTOs, summer capacity credits for solar in 2019 range 45-76% of a system’s nameplate capacity. Capacity credits have remained largely stable over the past years except in CAISO where solar’s capacity credit steeply declined in 2018.
Market Value: The market value of solar, defined here as the sum of the energy and capacity values, primarily varies across regions and years because of variations in average energy prices and capacity market prices. The energy value, based on the hourly solar generation and real-time power prices at pricing nodes near each solar plant, is the largest component of the market value across ISOs. In 2019, the average energy value spanned from $24/MWh in CAISO to $60/MWh in ERCOT. The capacity value of solar is based on the capacity credit of solar and the capacity price. The capacity value in 2019 was highest in the Southwest Power Pool (SPP; $25/MWh), though capacity prices there are based on estimates of bilateral capacity transactions rather than transparent organized capacity market prices, and lowest in the Midcontinent Independent System Operator (MISO; below $1/MWh).
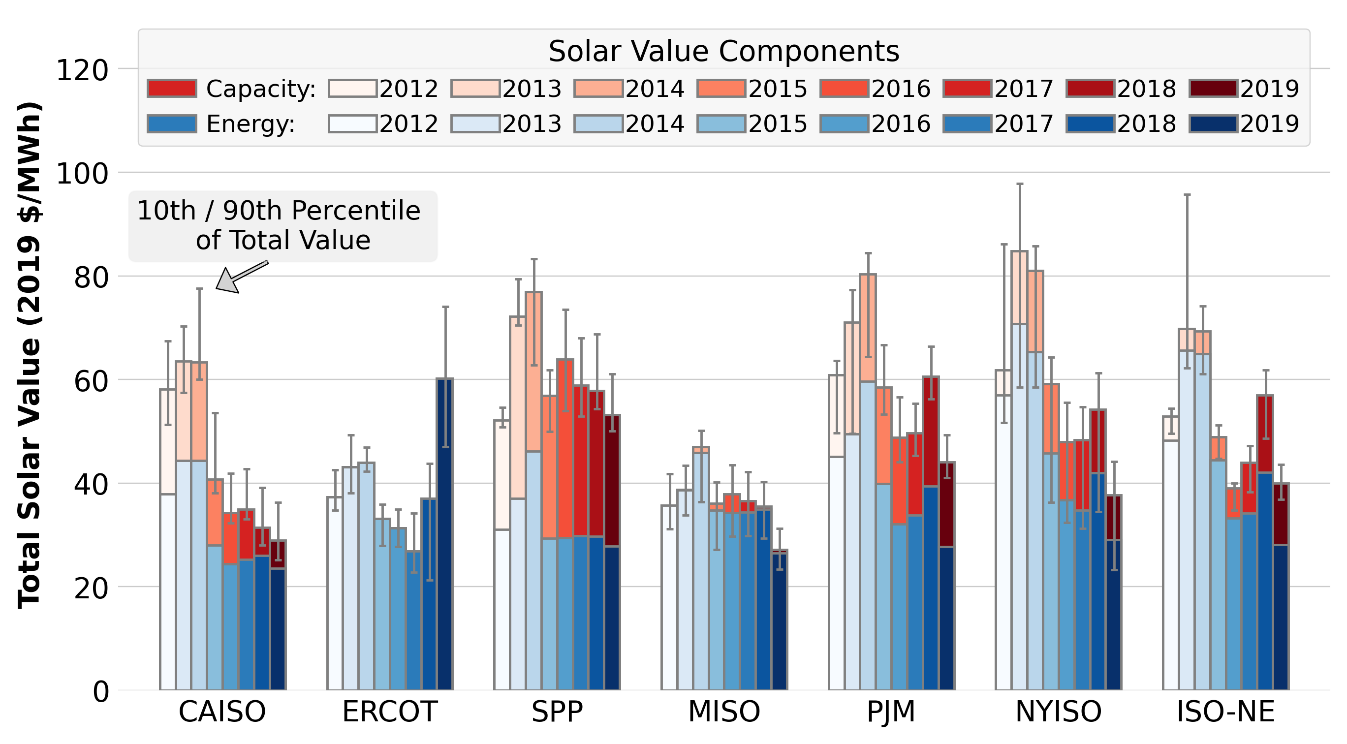
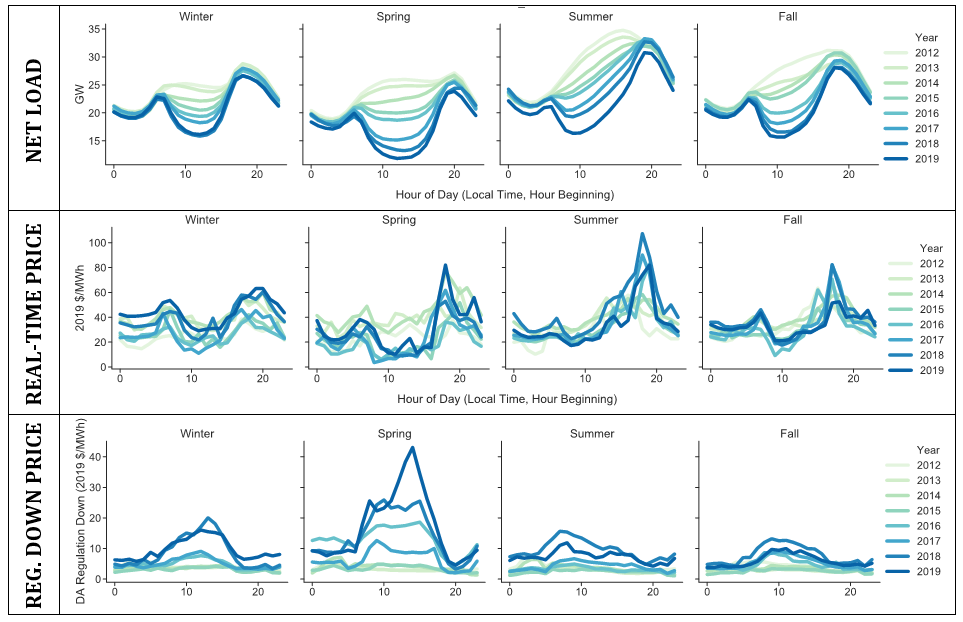
Market Value Decline: The market value of solar in CAISO declined between 2012 and 2019, both overall and relative to annual average energy and capacity prices. In 2012, solar’s market value in CAISO was 40% higher than the value of a flat block of power (representing the market value of a generator that operates at full nameplate capacity in all hours of the year). By 2019, however, solar’s value was 31% lower than a flat block of power’s value because of a solar-induced shift in the timing of high and low energy prices and a reduction in solar’s capacity credit. In contrast, the market values of solar in regions where solar penetrations were low did not decline relative to average prices.
Overall Competitiveness: As solar’s market value declined in CAISO, its cost—as measured by levelized power purchase agreement (PPA) prices—declined at a similar pace, thus maintaining solar’s overall competitiveness. Solar was more competitive in PJM and the non-ISO utilities where the market value in 2019 exceeded the levelized PPA price of contracts signed in 2019. Solar was especially competitive in ERCOT in 2019 as the energy value of solar rose significantly due to high wholesale electricity prices in the summer afternoons.
System Impact: In CAISO, the net load has shifted to resemble the “duck curve,” with particularly low net load during spring days and high ramps as the sun sets in the evening. Similar patterns emerge in real-time prices, with lower prices during the day and higher prices in the early evening. Ancillary service requirements, particularly regulation reserves, have increased during the day, as have regulation prices. Negative real-time prices during low net load days in the spring suggest growing challenges with providing flexibility. However, broader shifts in the system—including growing participation of western utilities in the Western Energy Imbalance Market and variations in hydropower levels—appear to have mitigated some challenges in 2019 relative to 2017, even with greater solar deployment in 2019. Impacts to the net load shape from solar are similarly evident in a number of non-ISO utilities in the Western U.S. With far less solar deployment in the other ISOs, solar impacts on the bulk power system are much less obvious.
Lessons from CAISO will be important as solar increases in penetration in other wholesale markets in the US and abroad.
The full Solar-to-Grid report, along with an accompanying summary slide deck can be found at the project page https://emp.lbl.gov/renewable-
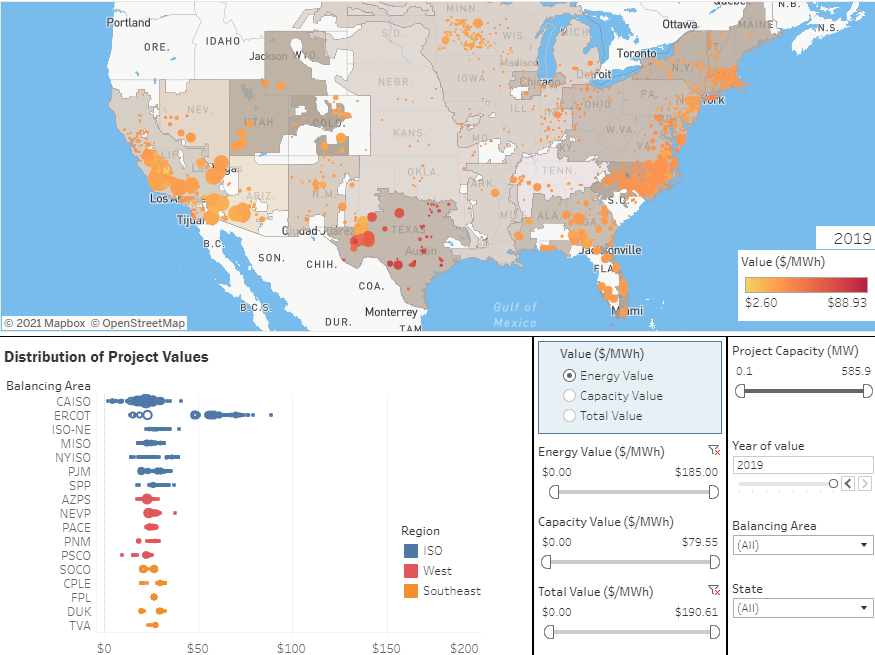
We also offer several free data products. These include: visualizations of solar capacity and generation by balancing area and an interactive map summarizing energy and capacity value for each solar plant in our study area; plant-level (utility-scale solar) and county-level (distributed solar) annual wholesale value estimates; and plant-level and county-level estimates of capacity credits. The full library of simulated hourly solar generation profiles from 2012–2019 at 2964 utility-scale solar projects and 2829 counties is available at the Open Energy Data Initiative.
A free webinar summarizing key findings from the report will be held on February 23 at 10 AM Pacific/1 PM Eastern. Register for the webinar here.
For questions on the report, please contact Andrew Mills ([email protected]) or Joachim Seel ([email protected]) at Lawrence Berkeley National Laboratory.
We appreciate the funding support of the U.S. Department of Energy Solar Energy Technologies Office in making this work possible.