Record amounts of zero-carbon electricity generation and storage now seeking grid interconnection

Berkeley Lab-led study shows over 1,300 gigawatts of solar, storage, and wind in interconnection queues - an indicator of a major energy transition underway, even if most proposed projects will not be built
The amount of new power generation and energy storage in the transmission interconnection queues across the U.S. continues to rise dramatically, with over 1,400 gigawatts (GW) of total generation and storage capacity now seeking connection to the grid, according to new research by Lawrence Berkeley National Laboratory (Berkeley Lab). The queues indicate particularly strong interest in solar, battery storage, and wind energy, which account for 93% of all proposed capacity. Altogether, this potential investment of over $2 trillion represents more capacity than the current U.S. power fleet.
However, most projects that apply for interconnection are ultimately withdrawn, and those that are built are taking longer on average to complete the required studies and become operational. Entering an interconnection queue is only one of many steps in the development process; projects must also have agreements with landowners and communities, power purchasers, equipment suppliers, and financiers, and may face transmission upgrade requirements. Data from these queues nonetheless provide a general indicator for mid-term trends in developer interest.
Berkeley Lab compiled and analyzed data from the seven organized electricity markets in the US and additional 35 utilities outside of those regions, which collectively represent over 85% of all U.S. electricity load. The findings are reported in a new slide deck, data file, and interactive visualization that synthesize data from transmission interconnection queues throughout the United States to illustrate trends in proposed power plants across technologies, time, and regions. Berkeley Lab’s data and analysis are also highlighted in a new paper from the U.S. Department of Energy’s Office of Policy focused on opportunities to improve interconnection and transmission policies.
“The sheer volume of clean energy capacity in the queues is remarkable,” said Joseph Rand, a Senior Scientific Engineering Associate at Berkeley Lab. “It suggests that a huge transition is underway, with solar and storage taking a lead role.”
Rand points out that the amount of solar, wind, and storage in the queues today is roughly the same amount needed to get to 80% of U.S. electricity from zero-carbon resources by 2030. President Biden has set ambitious goals to create a carbon pollution-free power sector by 2035 and net zero emissions economy by no later than 2050 in order to combat climate change. “The trends in these interconnection queues suggest that developers are eager to meet this ambition, though they may face some headwinds”, said Rand.
The future is bright – and windy
The total capacity in the queue at the end of 2021, around 1.4 Terawatts (TW), is greater than current U.S. generating capacity of 1.2 TW, and a full Terawatt higher than the queue in 2010. At current prices, the 1.3 TW of solar, wind, and storage capacity proposed equals just over $2 trillion in potential investment.

Existing U.S. capacity (2010 and 2021) compared to interconnection queue capacity (2010 and 2021).
Solar (676 GW) accounts for the largest share of generation capacity in the queues, but substantial wind (247 GW) capacity has also applied for interconnection. The amount of offshore wind capacity in the queues (77 GW) represents more than twice the Biden Administration’s goal of 30 GW installed by 2030. Developer interest in electricity storage has exploded in recent years, with capacity in the queues doubling in just one year, up to 427 GW.
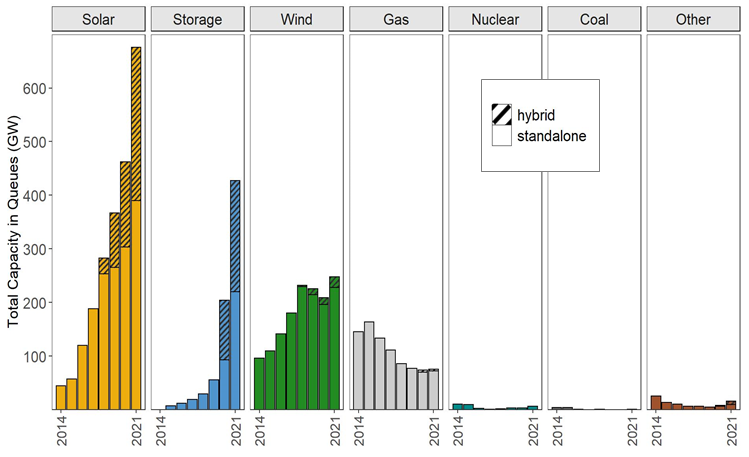
Total capacity in interconnection queues over time. *Hybrid storage capacity was estimated for some projects using known generator:storage ratios, and was not estimated for years prior to 2020.
Solar capacity in the queues is distributed across most U.S. regions, including most notably in PJM (147 GW), the non-ISO West (139 GW), and MISO (112 GW). Wind capacity in the queues is highest in the non-ISO West (49 GW), SPP (43 GW), and NYISO (41 GW, mainly offshore). Although proposed wind capacity has shrunk in some historically dominant wind regions like ERCOT and SPP, it has grown in others – particularly those with proposed offshore wind projects like NYISO, PJM, CAISO, and ISO-NE. Proposed storage is highest in CAISO (136 GW), the non-ISO West (122 GW), PJM (54 GW), and ERCOT (43 GW). Natural gas proposals center on the Southeast (24 GW) and PJM (17 GW), with less than 10 GW in all other regions.
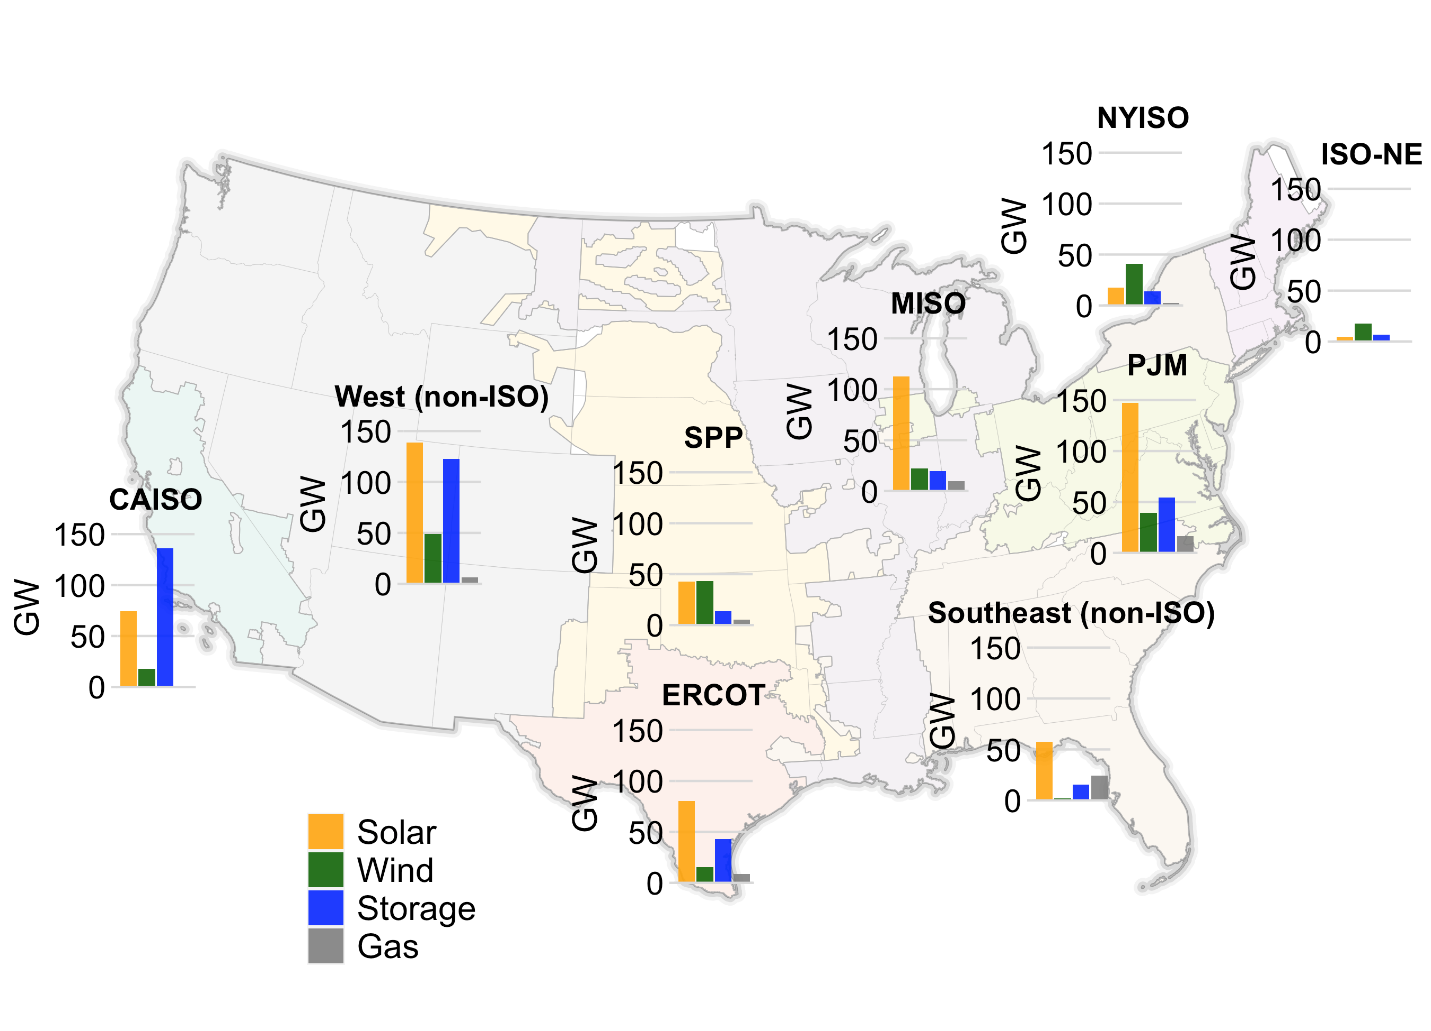
Regional distribution of proposed solar, wind, storage, and gas capacity.
Increasing interest in co-locating generation with storage
With falling battery prices and the growth of variable renewable generation, there has been a surge of interest in “hybrid” power plants that typically combine generating capacity with co-located batteries. At least 285 GW of solar capacity in the queues is proposed as a hybrid plant (42% of all solar in the queues), as is 19 GW of wind (8% of all wind in the queues). About half of all storage capacity in the queues is proposed in hybrid configurations with generation (208 GW).
Interest in hybrid projects is especially strong in CAISO and the non-ISO West, where 95% and 75% of the cumulative proposed solar is in a hybrid configuration, respectively. “Pairing electric generation with co-located storage can add market value and flexibility, especially in regions with a lot of wind and solar like California,” said co-author Will Gorman, also of Berkeley Lab. Indeed, virtually all of the solar capacity that entered the CAISO’s queue in 2021 was paired with on-site storage.
Backlogs, bottlenecks, and barriers: opportunities for improvement
But much of the proposed capacity in the queues will not ultimately be built since projects may not come to fruition for a variety of reasons. Looking back at a subset of queues for which data are available, only 23% of the projects seeking connection from 2000 to 2016 subsequently reached commercial operations. Completion percentages appear to be declining in recent years and are lower for wind and solar than for other resources.
Another concerning trend is that interconnection wait times are on the rise. Within the subset of regions with available data, the time required from an initial connection request to a project being operational increased from 2.1 years for projects built in 2000-2010 to 3.7 years for those built in 2011-2021. “Some of that delay may be attributable to factors outside of the interconnection process - such as securing local permitting or offtake agreements for the power produced,” said Ryan Wiser, also with Berkeley Lab. “But the data also show a recent increase in the time required to complete interconnection studies in many regions.” With the dramatically increasing volume of submitted projects, developers and grid operators alike are sounding alarms about backlogs in the queues.
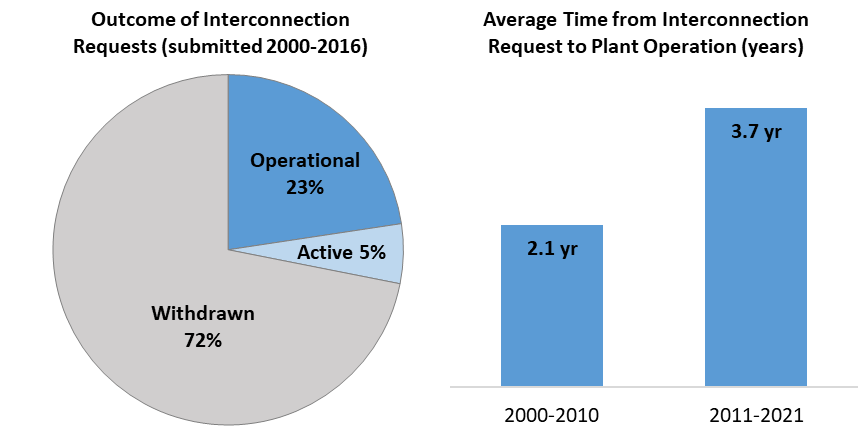
Completion rate and typical duration to reach commercial operations for projects in the queues.
Withdrawal rates and wait times in the queues suggest growing interconnection and transmission challenges and highlight the need to improve institutional processes. The Federal Energy Regulatory Commission has initiated an Advanced Notice of Proposed Rulemaking to study and address many of these issues. Several regional grid operators have already made substantial reforms to their interconnection processes, or have announced plans to do so. New research released today by the U.S. Department of Energy’s Office of Policy leverages Berkeley Lab’s queue data amongst a broader synthesis of research to highlight the importance of improved planning and policies for transmission and interconnection to enable clean power growth.
This data compilation and analysis was conducted by Berkeley Lab, with support from the U.S. Department of Energy’s Office of Energy Efficiency and Renewable Energy, including both the Wind and Solar Energy Technologies Offices.