Study provides a first-of-its-kind, nationwide analysis characterizing the ability of solar-plus-storage systems to provide backup power during long-duration power interruptions

We are pleased to announce the release of a new report evaluating the backup power capabilities of behind-the-meter solar-plus-energy storage systems (or PVESS). The study simulates PVESS performance in providing critical-load or whole-building backup power across a wide range of geographies, building types, and power interruption conditions. The study also considers a set of 10 historical long-duration (greater than 24-hour) power outages, and evaluates how PVESS could have performed in providing backup power during those events.
The analysis is the first in what will be a series of studies by Berkeley Lab, in collaboration with the National Renewable Energy Laboratory, on the use of PVESS for backup power. This initial study is intended to provide a baseline set of performance estimates and to illustrate key performance drivers. The report, entitled Evaluating the Capabilities of Behind-the-Meter Solar-plus-Storage for Providing Backup Power during Long-Duration Power Interruptions, is published in slide-deck format and is accompanied by a 7-page narrative summary. The authors will also host a webinar summarizing key findings from the report on October 6th at 10:00 am Pacific.
The analysis relies on simulated loads, solar generation, and storage dispatch. The following are a few select findings, focusing on the analysis of single-family detached homes. The report also covers mobile homes and multi-family homes, as well as a selection of non-residential building types (hospitals, schools, and big-box retail stores).
Backup performance depends, first and foremost, on PVESS sizing and the set of critical loads selected for backup. If heating and cooling loads are excluded from backup, a small PVESS with just 10 kWh of storage (the lower end of sizes currently observed in the market) can fully meet basic backup power needs over a 3-day outage in virtually all U.S. counties and in any month of the year. If, instead, critical loads include heating and cooling, a PVESS of that size would meet 86% of critical load, on average across all counties and months, while a larger PVESS with 30 kWh of storage (the upper end of sizes currently observed in the market) would meet 96% of critical load. Those results are shown by the dashed line in the left-hand panel of Figure 1, which represents the population-weighted average across counties.
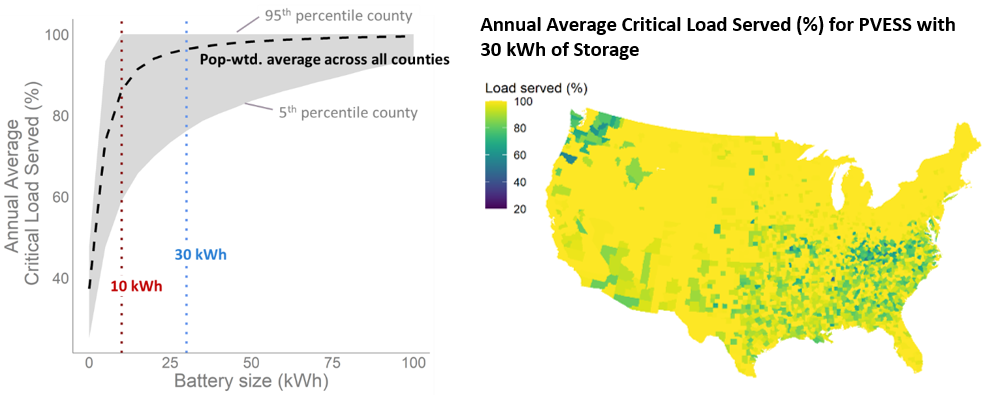
Figure 1. PVESS Backup Performance for Single-Family Residential Buildings
Notes: The figures are based on an analysis of the median home in each county (in terms of annual electricity consumption), and show the percent of critical load (with heating and cooling) served over 12 monthly outages, each 3 days in length. Percentile values in the left-hand figure are based on annual average critical load served.
Backup coverage of heating and cooling loads varies considerably across regions, depending on climate and building stock characteristics. In particular, performance tends to be lowest in regions where electric heating is common (the southeast and northwest), and also in regions with large cooling loads (the southwest and parts of the southeast), as shown in the right-hand panel of Figure 1. Important to note is that these results are based on the existing U.S. building stock, where electric space heating consists primarily of electric resistance-based heating, rather than heat pumps, as well as on typical battery sizing currently in the market.
Backup performance can also vary considerably within individual regions, based on variation in the underlying building stock. Focusing on one county with a particularly high degree of variability (Harris County, Texas, home to Houston), Figure 2 shows how backup performance for a PVESS with a given storage size (30 kWh) declines for higher-usage homes. That trend is related to a number of underlying building stock conditions. In particular, the report reveals significant performance differences based on heating technology (electric resistance vs. heat pumps vs. fossil heating), building infiltration rates (the leakiness of the building), air-conditioner efficiency, and temperature set-points.
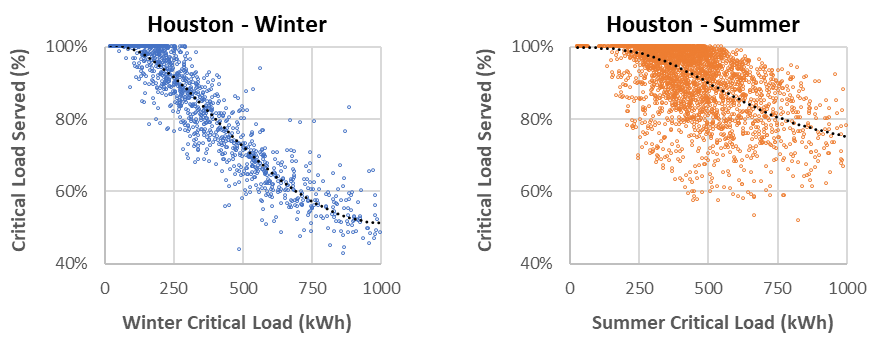
Figure 2. Backup performance across individual modeled homes in Houston (Harris County, TX).
Notes: Each dot in the figures represents the results for a single home and shows average critical load served during interruptions in winter months (left) and summer months (right).
Backup performance for homes with electric heat or high cooling loads is quite sensitive to weather variability. For example, among counties with high penetration of electric heat, between 53% and 96% of critical load is served during winter months, depending on which specific day the outage begins in each month. A similar but less dramatic trend can be observed for homes with high cooling loads. Even greater variability would occur under more extreme weather conditions than explored in our analysis.
Backup performance is fairly insensitive to outage duration beyond 1-day. In general, backup performance declines as outage duration increases, though the effect is relatively modest, given the ability of PV to recharge the batteries each day. For a PVESS with 30 kWh of storage and critical loads that include heating and cooling, backup performance drops from a population-weighted average of 100% of critical load served for a 1-day outage to 92% for a 10-day outage.
In 7 of the 10 historical outage events analyzed, the majority of homes would have been able to maintain critical loads with heating and cooling, using a PVESS with 30 kWh of storage. Considerable variability exists among the five hurricane events (grouped on the left-hand side of Figure 3), driven by differences in solar insolation levels. The lowest performing event was Hurricane Florence, where almost no PV generation occurred over the first three days of the ~8-day outage due to cloud cover. For the two winter storms analyzed, all critical load was served in the median case, but a sizeable fraction of customers—those with electric heating—saw much lower performance.
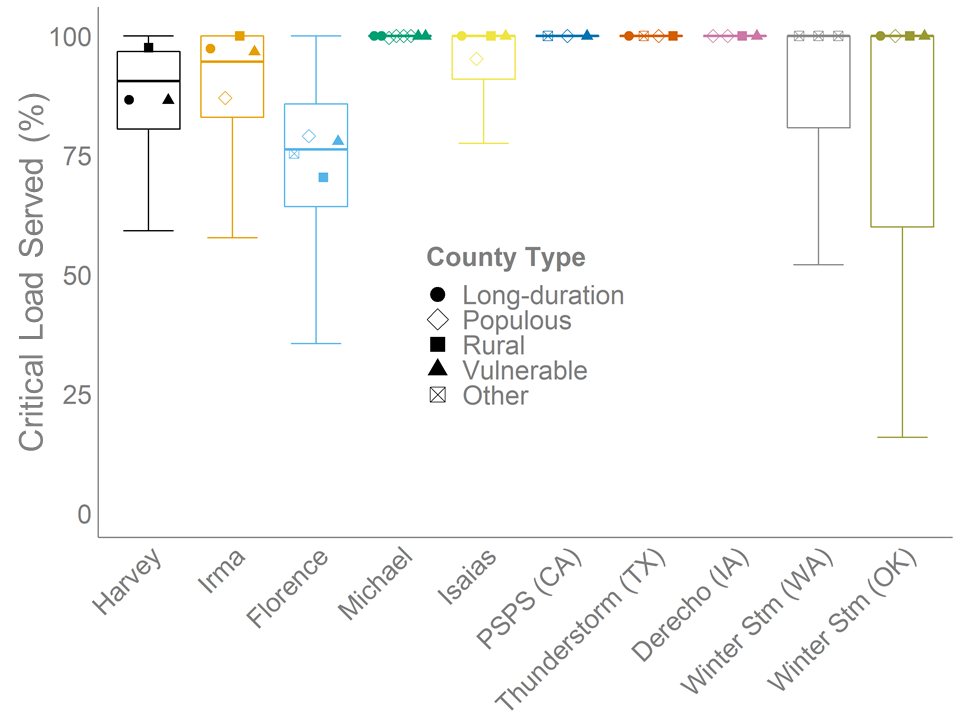
Figure 3. PVESS Backup Performance across 10 Historical Long-Duration Outage Events
Notes: The figure is based on a simulation of backup performance for single-family homes in 3-4 affected counties for each event. Box-and-whiskers plots above show the distribution across all modeled homes (500 per county). The icons show median values for homes in each of the selected counties, identified by their county-type. See full report for further details on the methodology and the events modeled here.
The findings highlighted above represent just a fraction of the full report, which provides more details on those findings, explores additional performance drivers (such as the initial state of charge on the battery and alternate PV sizing assumptions), and presents results for whole-building backup and for other residential and non-residential building types. The report also highlights opportunities for further work.
We thank the U.S. Department of Energy Solar Energy Technologies Office for their support of this work, as well as the numerous individuals and organizations who generously provided data for this ongoing effort.