Updated report and data illustrate distributed solar pricing and design trends

We are pleased to announce the release of Berkeley Lab’s latest edition of its Tracking the Sun annual report, describing pricing and design trends for grid-connected, distributed solar photovoltaic (PV) systems in the United States. The latest edition is based on data from roughly 2.2 million systems installed nationally through year-end 2020.
The report describes trends related to:
- Project characteristics, including system size, module efficiencies, prevalence of paired PV with storage, use of module-level power electronics, third-party ownership, mounting configurations, panel orientation, and non-residential customer segmentation.
- Median installed-price trends, including both long-term and more recent temporal trends at the national and state levels, with comparisons to other recent PV cost and pricing benchmarks as well as to prices reported for other countries.
- Variability in pricing across individual projects based on system size, state, installer, module efficiency, inverter technology, and non-residential customer type. The report also includes an econometric analysis to estimate the effects of individual pricing drivers on installed prices for host-owned residential systems installed in 2020.
Click here for the most up-to-date version of the report,
Key Trend: Figure 1 below illustrates one of the key trends from the report, showing median U.S. installed prices over time, for residential, small non-residential, and large non-residential systems. Median prices across all three sectors have fallen over the long-term by roughly $0.4 per Watt (W) per year, on average, but have tapered off since 2014, dropping by $0.2/W per year since then. Over the last year of the analysis period (2019-2020), median prices for residential systems remained effectively flat at $3.8/W, while price declines in the non-residential sector continued on their recent historical trajectory, falling by $0.2/W for both small and large non-residential systems. For further discussion of these and other key market trends, join the webinar or refer to the report and accompanying data resources.
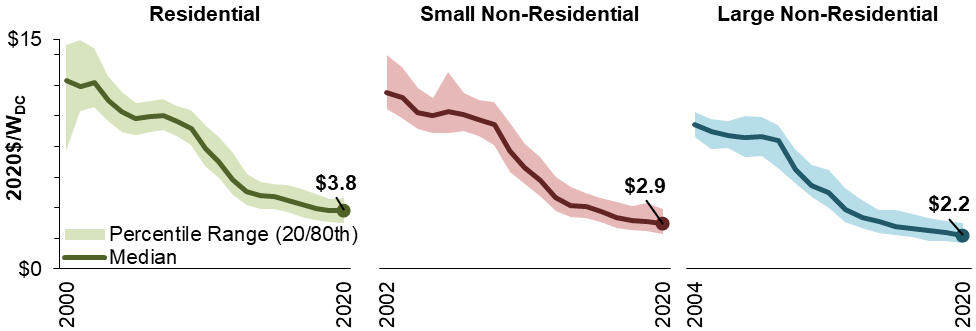
Figure 1. National Installed Price Trends
Notes: Based on a subset of the overall data sample that excludes third-party owned (TPO), paired PV+storage, and self-installed systems. Small vs. Large Non-Residential systems are differentiated based on a 100-kW size threshold.
We thank the U.S. Department of Energy Solar Energy Technologies Office for their support of this work, as well as the numerous individuals and organizations who generously provided data for this ongoing effort.