Updated “ReWEP tool” allows exploration of recent trends in wholesale power prices and renewable energy supply

Exploring Wholesale Energy Price Trends: The Renewables and Wholesale Electricity Prices (ReWEP) tool, Version 2022.1
The Renewables and Wholesale Electricity Prices (ReWEP) visualization tool from Berkeley Lab has been updated with nodal electricity pricing and wind and solar generation data through the end of 2021. The tool allows users to explore trends in wholesale electricity prices and their relationship to wind and solar generation. Variable renewable generation impacts pricing patterns at the local level, but those patterns are often obscured when looking at regional average annual pricing trends.
The ReWEP tool allows users to compare pricing trends across locations, regions, and a number of different timeframes, down to the nodal level. These comparisons illustrate the ongoing interactions between wind and solar generation and wholesale energy prices.
The ReWEP tool consists of maps, time series, and other interactive figures that provide: (1) a general overview of how average pricing, negative price frequency, and extreme high prices vary over time, and (2) a summary of how pricing patterns are related to wind and solar generation. Interactive functionality allows investigation by grid regions (ISOs/RTOs), year, and season, and over diurnal cycles.

Figure 1. This screen-shot from the ReWEP tool shows annual average nodal prices across the major wholesale electricity markets in the United States in 2021. Of note are the unusually high prices in ERCOT in 2021, which were due to extreme weather in February 2021. The user can also choose to map the frequency of negative prices and the average price of the 100 hours in each year with highest prices.
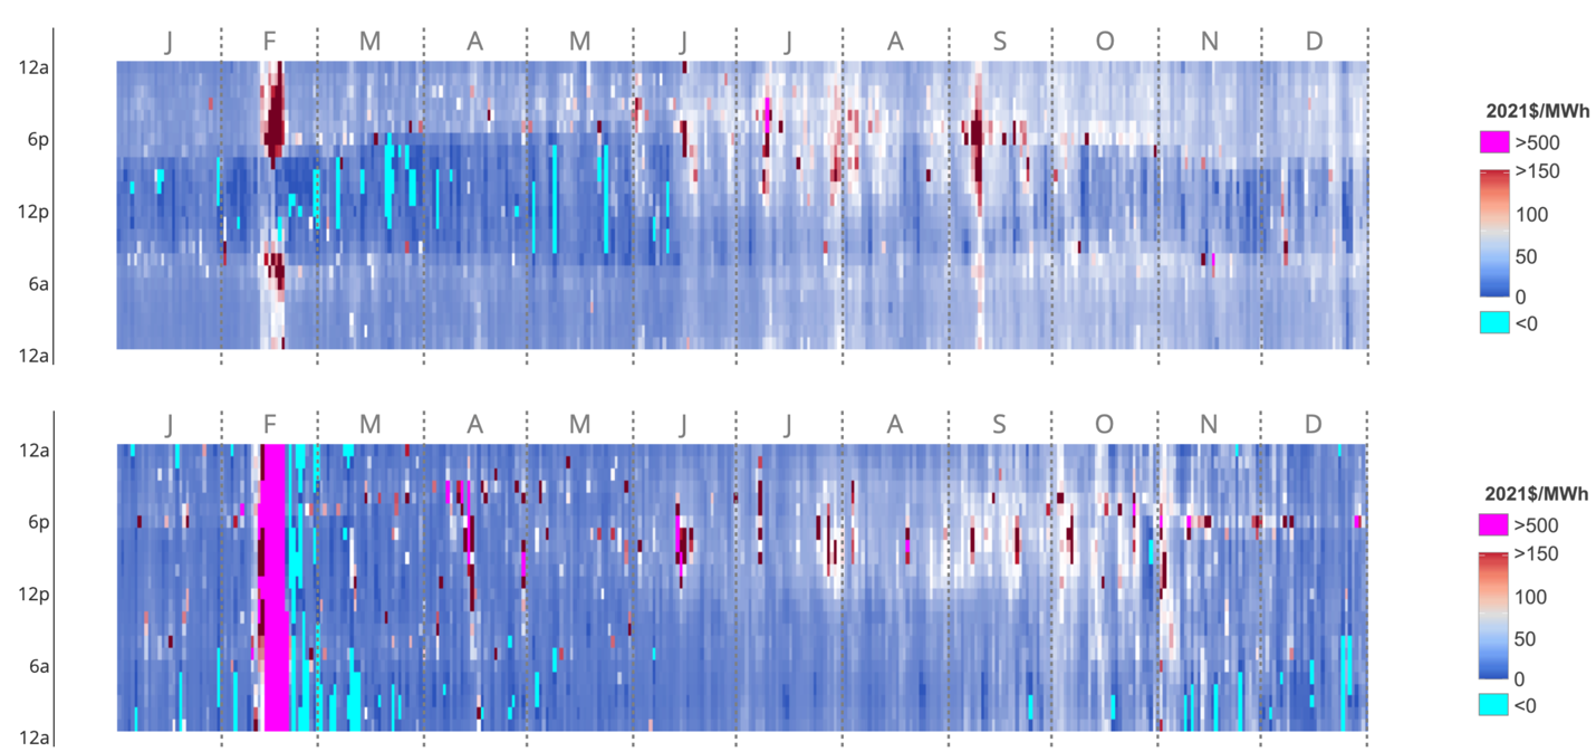
Figure 2. This screen-shot from the ReWEP tool shows the regional average hourly price by day and hour (365X24) for CAISO in California (top) and ERCOT in Texas (bottom). High prices in ERCOT in 2021 were driven by the extreme weather in February 2021. In CAISO, a clear solar profile is visible with darker blues showing lower prices during sunny hours.
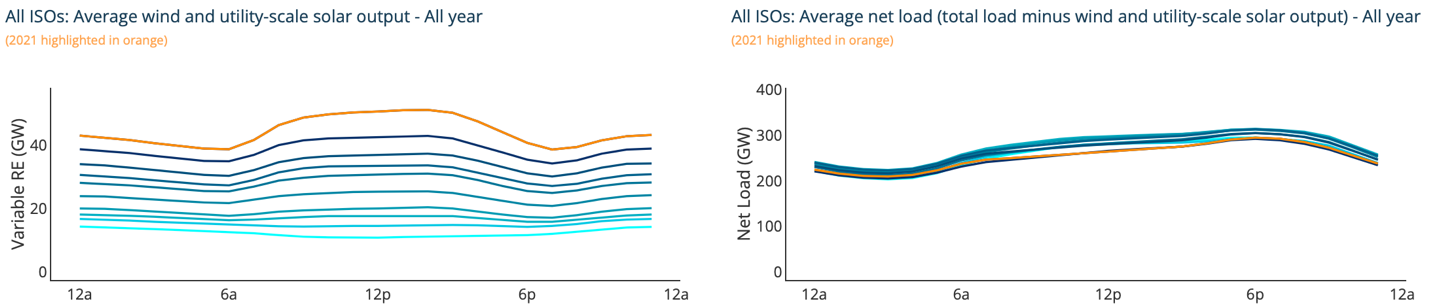
Figure 3. This screen-shot from the ReWEP tool shows the daily cycle of wind and solar generation (left) and the net-load (right) summed across all 7 wholesale markets. Each line represents a different year, with darker lines being the most recent (and 2021 highlighted as orange). Renewable energy generation has expanded across all hours and years (back to 2012), and net load has begun to decline in response (implying that wind and solar are being added faster than the growth in electricity demand).
Figures 1 through 3 above highlight visualizations that can be created with the tool. Some key observations for 2021 revealed in the example figures, and in the tool as a whole, include:
- Wholesale electricity prices increased across all regions in 2021 relative to 2020, but increases were more pronounced in ERCOT and SPP as a result of extreme weather in February 2021 (See Figures 1 and 2).
- Solar generation adds to electricity supply and helps drive down prices in the CAISO region during sunny hours. CAISO also experienced increased prices during the February extreme weather event, however CAISO prices during this period were elevated only when the sun was down. (See Figure 2).
- In CAISO and ERCOT, the daily variation in prices highlights the potential intraday storage arbitrage opportunity (Figure 2).
- Consistent growth in wind and solar generation is outpacing electricity growth and starting to reduce overall net-load (Figure 3).
- In 2021, negative prices (shown as the aqua blue color in Figure 2) occurred most frequently during daytime in CAISO and nighttime in ERCOT. ReWEP allows the user to explore negative pricing trends in each ISO (negative prices were most frequently observed in SPP).
The ReWEP tool can be found at: https://emp.lbl.gov/
We appreciate the funding support of the U.S. Department of Energy Solar Energy Technologies Office and Wind Technologies Office in making this work possible.